Working with CSV files
How to read data from external files in CSV format. By Benedikt Groß

CSV - Data to a circles
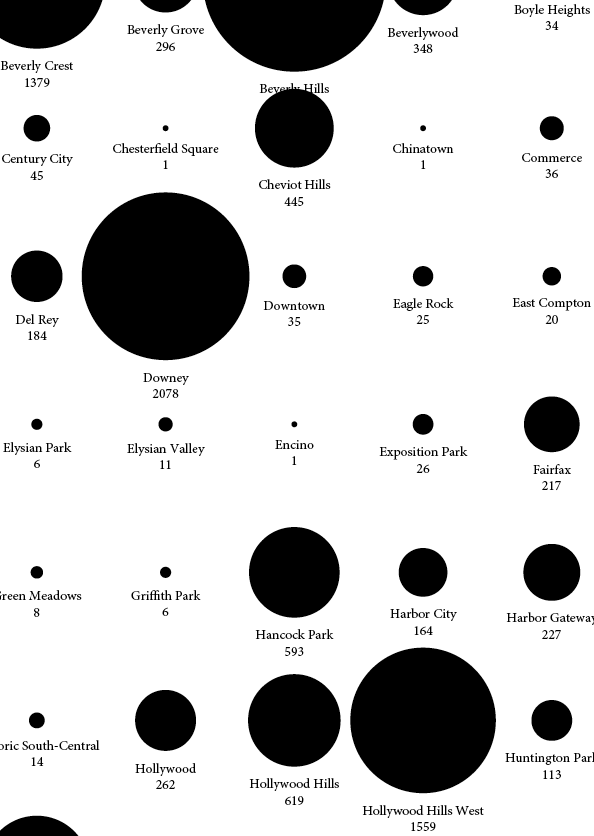
In this short tutorial we are going to use a dataset of the swimming pool count of all neighborhoods in Los Angeles to create a diagram of circles. The pool count of the individual LA neighborhood will be encode to the area of the circles. Data courtesy The Big Atlas of LA Pools.
But first of all, what is a CSV file?
A CSV file is a text file with comma-separated values, think of a spreadsheet or a Microsoft Excel file. The first row in the file specifies the names of the columns, all other rows hold the data. If you open a CSV file in an text editor your should see something like this:
hoodname,poolcount
Long Beach,2859
Rancho Palos Verdes,2592
Beverly Hills,2481
 ...
Preparations
- Create somewhere a folder for the tutorial and save a blank indesign file into that folder e.g. LA_Pools/circles.indd
- Create a data folder within the project folder to hold the data: LA_Pools/data/
- Get the dataset and copy it to the data folder: LA_Pools/data/LA_Pools-Pools_per_Hood.csv
Load the data
Loading the CSV data is basically just one line of code:
b.CSV.decode( b.loadString("data.csv") ).
Reading it from inside to outside reveals the following, loadString() just loads the entire content of the file into basil. b.CSV.decode() decodes then this content to columns and rows. The schema to get the data is:
// data[ row_number ].column_name
// get the 2nd row
b.println( data[2].hoodname ); // -> Beverly Hills
b.println( data[2].poolcount ); // –> 2481
As the CSV doesn't have types, it is not clear whether the data is a numbers or a string. Hence we have to take care that all columns of numbers are converted to the correct type. You can do that for instance with the functions parseInt() or parseFloat().
#includepath "~/Documents/;%USERPROFILE%Documents";
#include "basiljs/bundle/basil.js";

function draw() {
  //load data
  var data = b.CSV.decode( b.loadString("LA_Pools-Pools_per_Hood.csv") );
  b.println("loaded "+data.length+" neighborhoods");

  // parse to numbers
  for (var i = 0; i < data.length; i++) {
    data[i].poolcount = parseInt(data[i].poolcount);
    b.println(i+" "+data[i].hoodname+" "+data[i].poolcount);
  };
}

b.go();
Draw the circles
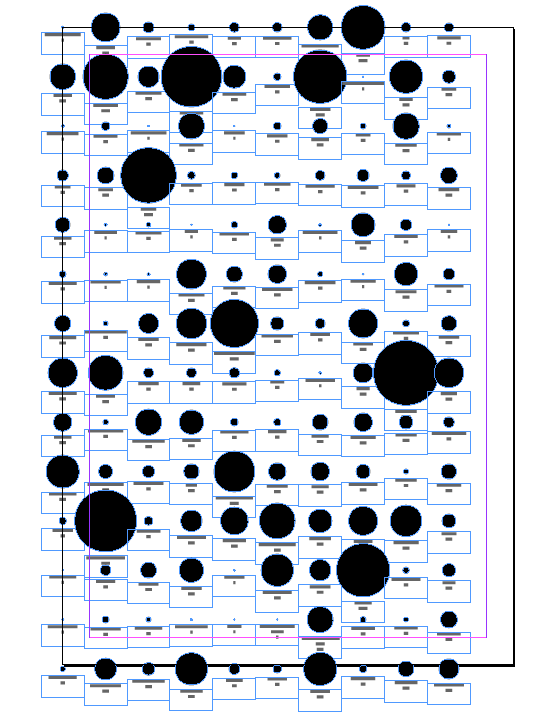
After loading the data it is now time to draw the data. The poolcount value is mapped to the area of the circles with the function calcRadiusByArea(). The gird layout is created with the help of the two for loops. It takes a bit of fiddling around to come up with the right dimensions of 10 x 14 units to fit the layout onto the page, just play around with the for loops (e.g. change the values of the 10 and 14) ... And last, labeling the circles was done with a combination of the hoodname and poolcount value.
#includepath "~/Documents/;%USERPROFILE%Documents";
#include "basiljs/bundle/basil.js";

function draw() {
  // load & convert
  var data = b.CSV.decode( b.loadString("LA_Pools-Pools_per_Hood.csv") );
  for (var i = 0; i < data.length; i++) {
    data[i].poolcount = parseInt(data[i].poolcount);
  };

  // circles
  b.textSize(6);
  b.textAlign(Justification.CENTER_ALIGN);
  b.units(b.MM);

  var i = 0;
  var gridUnitSize = 20;
  var paddingBottom = 3

  for (var y = 0; y < 14; y++) {
    for (var x = 0; x < 10; x++) {
      var posX = x*gridUnitSize;
      var posY = y*(gridUnitSize+paddingBottom);

      var poolcount = data[i].poolcount;
      var radius =  calcRadiusByArea(poolcount) * 0.5; // scale down
      var diameter = radius * 2;
      b.ellipse(posX,posY,diameter,diameter);

      var hoodname = data[i].hoodname;
      b.text(hoodname+"n"+poolcount,
             posX-gridUnitSize/2, posY+radius+2,
             20,10);

      // stop drawing if no more rows are available
      if (i > data.length) break;

      i++;
    };
  };
}

function calcRadiusByArea(A){
  // A = Pi * r * r
  return Math.sqrt(A/Math.PI);
}

b.go();
Your results should look similar to this one :)
The circle gird
Cirlce layout detail